The Hidden Cost of Clicks: How Our Advanced Technology is Destabilizing the Planet

I. The Disconnect: Your Weather, Our Technology
There is a profound disconnect in our modern lives. On one hand, we observe the world around us with growing unease. We feel the suffocating, “hotter and hotter” heat of the summer and read about record-breaking heat waves. Yet, we also experience the paradox of “higher and higher” coolness in winter, with brutal cold snaps that seem to defy the very concept of “global warming.”
On the other hand, we live our lives through the clean, ethereal lens of “advanced technology.” We interact with “the cloud,” a concept designed to evoke weightlessness and purity. We stream, we search, we connect, and these actions feel massless, virtual, and harmless.
This report will demonstrate that these two observations—the destabilized climate and the rise of digital technology—are not parallel trends. They are a direct, causal chain. The “innocence” of the public regarding the true cost of technology is the central problem. We have been conditioned to ignore the vast, physical, heavy industry behind the “virtual” world.
This report will shatter that illusion. It will connect the dots from the phone in your hand, to the sprawling data centers that power it, to the toxic mines where it’s born, and to the poisoned dumps where it dies. In doing so, it will provide the “complete explanation of causes” requested—proving how the engine of our digital age is “killing us day by day” by fueling the very climate chaos we are now experiencing.
Validating the Observation: The “Oven” and the “Freezer”
Your observations are not just a feeling; they are a statistical and scientific reality.
The “Oven”: The Science of Extreme Heat
The hotter summers are a direct, documented consequence of a warming planet. The scientific field of “extreme event attribution” now allows researchers to calculate the specific human contribution to individual weather events.1 The findings are unequivocal: human-caused climate change is making heat waves more frequent, more intense, and longer-lasting.2
This is not a gentle, uniform warming. It manifests as acute, deadly events. In the United States, heat-related illnesses kill more people on average than any other weather disaster.4 These events are often driven by “heat domes,” a phenomenon where high pressure in the atmosphere acts as a “dome or cap,” trapping heat near the surface “like a lid on a pot”.5 A study of the 2003 European heatwave, which killed over 70,000 people, found that human influence had at least doubled the risk of such an event occurring.1
The “Freezer”: The Polar Vortex Paradox
This is where the public “innocence” begins. If the globe is warming, how can winters be getting colder? This is not a contradiction; it is a symptom of the warming. A growing bodyof research links a rapidly warming Arctic—a phenomenon known as “Arctic Amplification”—to disruptions in the stratospheric polar vortex.7
Here is the mechanism:
- The Arctic is warming much faster than the rest of the planet.7
- This reduces the temperature difference between the frigid pole and the warmer mid-latitudes.
- This temperature difference is the “engine” that drives the strong, stable jet stream that circles the pole. A weaker engine means a weaker, “wavier” jet stream.8
- This disruption “stretches” 9 or “splits” the stable polar vortex, which normally acts as a cage, holding the coldest air at the pole.
- This “stretched” or “disrupted” vortex allows lobes of frigid, polar air to escape and plunge southward, causing the record-breaking cold spells in places like Texas 10 and across Eurasia.11
You are not observing “global warming.” You are observing climate destabilization. We have broken the planet’s thermostat, and the result is not just a warmer average but wilder swings between deadly extremes.
Introducing the Culprit: The Industrial Engine of “The Cloud”
The thesis of this report is simple: the energy-intensive, resource-devouring, and waste-producing industry of “advanced technology” is a primary, accelerating driver of this climate destabilization.
The “innocence” of the public is not an accident. It is the result of a deliberate marketing abstraction. The reality is that “the cloud” is not a cloud at all. It is a physical factory.12 Every search, every stream, every AI-generated image has a physical cost in energy, water, and minerals. The energy to manufacture a single computer chip can be greater than the energy that chip consumes in its entire 10-year lifetime.13 The mining for the “rare earth” minerals in our devices is a process of soil erosion, water contamination, and habitat destruction.14
This report will trace this entire “cradle-to-grave” lifecycle. We will expose the unseen engine of the data centers, the accelerant of AI, the toxic birth and death of our devices, and connect it all back to the “fever and chills” of our planet.
II. The Unseen Engine: The True Cost of “The Cloud”
Every click, every stream, and every search query initiates a command in a physical facility.12 These “data centers” are the unseen engines of the digital age—massive, nondescript warehouses that are, in effect, factories for processing information. Their collective appetite for energy and resources is staggering, and it is growing at a rate that threatens to undermine global climate goals.
The Gluttony of Data: The Data Center Footprint
A data center is an industrial-scale operation. It houses thousands of computer servers, storage devices, and network equipment that run 24/7.12 This non-stop operation consumes a vast amount of electricity.
In 2023, U.S. data centers alone consumed approximately 176 terawatt-hours (TWh) of electricity. This figure represents 4.4% of all U.S. annual electricity consumption.12 This is already a massive footprint, but it is the projection that is truly alarming.
A U.S. Department of Energy report, based on research from Lawrence Berkeley National Laboratory (LBNL), finds that this demand is projected to double or triple by 2028.12 At that point, U.S. data centers could consume up to 12% of the nation’s total electricity.12
Why do they use so much power? The energy draw is twofold. Roughly half of the electricity is for the IT equipment itself.12 “Much of the rest,” however, is for one of the most critical and energy-intensive parts of the operation: cooling.12 The servers generate immense heat, and they must be kept cool to function.
This cooling process is not only energy-intensive but also incredibly water-intensive. Data centers use various cooling strategies, from air-based systems (CRACs) to chilled water loops.12 Methods that consume water are often the most effective at rapid heat exchange. The scale of this water use is shocking: one study estimates that a single 100-megawatt U.S. data center consumes roughly the same amount of water as 2,600 U.S. households.12 In an era of increasing droughts and water scarcity, we are diverting finite freshwater resources to cool servers.
The AI and Crypto Accelerant: The Demand Drivers
This explosive growth in demand is not a normal trend. It is being driven by two new, uniquely power-hungry technologies: Artificial Intelligence and Cryptocurrency.
Artificial Intelligence (AI): The New “Gold Rush”
AI—particularly generative AI models like GPT-4—is the single most significant driver of this new energy demand.16 The International Energy Agency (IEA) projects that electricity demand from AI-optimized data centers will quadruple by 2030.17
Training these models, which have billions of parameters, requires “a staggering amount of electricity”.16 But the energy cost doesn’t end there. It is a constant cycle:
- Training: The initial process that can take weeks or months, consuming massive amounts of power.16
- Deployment (Inference): The energy used every time a user asks a question or generates an image.16
- Fine-Tuning: The constant process of re-training and updating the models.16
To put this in perspective, a single ChatGPT query requires 10 times more electricity than a simple Google search.19 The IEA projects that in the United States, data centers will drive almost half of all growth in electricity demand between now and 2030. By 2030, the U.S. economy is set to consume more electricity processing data (driven by AI) than for manufacturing all energy-intensive goods—like aluminum, steel, and cement—combined.17
This “AI gold rush” 16 has created a sudden, massive, and permanent new baseline of energy consumption that our grids are not prepared for. After years of stagnating or declining demand in many advanced economies, this new AI-driven load is putting power sectors “back on a growth footing”.17 This soaring need has a direct climate consequence: it has slowed the retirement of coal-fired power plants as utilities scramble to maintain grid reliability.13 The AI revolution is in direct competition with the green energy transition.
Cryptocurrency: The “Environmental Waste”
If AI is the new engine of demand, cryptocurrency mining is its most “wasteful” 20 and profligate cousin. The “proof-of-work” protocol used by Bitcoin is designed to be energy-intensive.
The IMF provides a horrifying statistic: one Bitcoin transaction requires roughly the same amount of electricity as the average person in Ghana or Pakistan consumes in three years.19
The entire Bitcoin network’s annual electricity consumption is comparable to that of a mid-sized country, like Poland.20 Globally, crypto mining and data centers together accounted for 2% of world electricity demand in 2022, a figure projected to climb to 3.5% in just three years—equivalent to the current consumption of Japan.19 This activity also has a massive water footprint, using billions of liters of water for the same cooling purposes as data centers.20
While the tech industry often boasts of “efficiency gains” 21, these gains are being completely overwhelmed. This is a classic “rebound effect”: as a technology becomes more efficient, we simply use it more. But AI and crypto are something new—a new type of demand so massive that it erases all efficiency gains and sends total consumption skyrocketing.
To make the abstract costs of our “innocent” digital lives tangible, the following table translates these vast numbers into human-scale analogies.
Table 1: The Hidden “Cost” of a Single Click
| Digital Action | Energy Cost (Analogy) | Water Cost (Analogy) | Data Source(s) |
| One Bitcoin Transaction | ~3 years of electricity for an avg. person in Ghana or Pakistan. | ~1.5 billion liters/year (total network, 2021). | 19 |
| One ChatGPT Query | ~10 times more electricity than one Google Search. | Part of data center cooling. | 19 |
| A 100-Megawatt Data Center (Annual) | Equivalent to a small city. | ~2,600 U.S. households. | 12 |
| Manufacturing One Smartphone | Can be greater than all the energy the phone consumes in its 10-year lifetime. | ~12,760 liters (from mining to mfg). | 13 |

III. The Toxic Life Cycle: The “Physical” Cost of Our Devices
The “cloud” runs on physical hardware. Our “advanced technology” is not virtual; it is a physical product that has a “cradle-to-grave” lifecycle. This supply chain begins in a mine, is forged in a carbon-intensive factory, and ends in a toxic dump. The emissions and pollution from this physical process are a massive, overlooked driver of climate change.
Part 1: The Birth (Mining and Manufacturing)
We are conditioned to worry about the energy used to charge our devices. This is a misdirection. The vast majority of a device’s carbon footprint is “embodied” in it before it is ever switched on.
The Carbon-Intensive “Fabs”
The manufacturing of semiconductors—the brains of all our electronics—is one of the most carbon-intensive processes on Earth.23 For a company like Apple, manufacturing accounts for 74% of its entire carbon footprint.24
The fabrication of a single chip can consume more energy than the chip itself will use in its entire 10-year lifetime.13 This is because manufacturing advanced semiconductors is incredibly complex, requiring 1,000-degree Celsius ovens 13, massive amounts of electricity 23, and high-energy extreme ultraviolet (EUV) light to etch billions of transistors onto a tiny piece of silicon.13 This process also uses various chemicals and process gases that contribute to greenhouse gas emissions and long-term environmental contamination.25
As our chips become more powerful, this problem gets worse, not better. Manufacturing more advanced chips requires more complex processes, which consume more electricity. The industry’s carbon emissions are projected to rise by 8% annually in the coming years if unchecked.23
The “Rare Earth” Scourge
Every device also contains a cocktail of “rare earth elements” (REEs) and precious metals like gold and silver.26 The mining of these materials is environmentally devastating. These mines, often in regions of rich biodiversity, lead to massive soil erosion, air pollution, and water contamination as chemicals are used to leach the minerals from the earth.14 This, in turn, destroys habitats and disrupts entire ecosystems.14
This creates a terrible paradox. The “green energy” transition (wind turbines, EV batteries) and the “digital revolution” (AI servers, smartphones) are in a zero-sum competition for the exact same, toxically-mined rare earth minerals. Our demand for a new iPhone is in direct competition with our need for a new wind turbine.
Part 2: The Design (The Obsolescence Engine)
This relentless cycle of extraction and carbon-intensive manufacturing is not accidental. It is a business model. It is called “planned obsolescence”.29
This is the “common business practice of intentionally limiting a product’s useful life… to increase consumption”.31 It is the reason new models are released annually, why software updates slow down old phones, and why products that “work perfectly” are made to “go out of style”.29 This model is the engine that fuels overproduction and overconsumption.32
This engine is supercharged by the culture of e-commerce and “fast shipping.” Consumers have been “trained” by giants like Amazon to expect speed, convenience, and “free” shipping as a right.33
But “fast shipping” is a climate lie. The logistics and transport sector contributes to over a third of global carbon dioxide emissions.34 There is a direct trade-off: “slower is greener”.35
- Fast Shipping (1-2 days) requires carbon-intensive air freight and inefficient, half-empty “last-mile” delivery vans.
- Slow Shipping (5-7 days) allows for consolidation on lower-carbon transport like trucks, rail, or container ships.
Research from MIT shows that customers who wait up to five days for delivery could decrease carbon dioxide emissions from that delivery by about 30%.35 But the demand for speed, driven by consumer expectations 33, is locking in a high-carbon supply chain. The “true cost” of “fast, free” shipping is externalized and paid by the atmosphere.36
Part 3: The Death (The E-Waste Mountain)
This linear “take-make-dispose” model ends in a literal mountain of toxic waste. This “e-waste”—discarded computers, phones, and appliances—is the fastest-growing solid waste stream in the world.37
The numbers are difficult to comprehend. In 2022 alone, humanity generated 62 million tonnes of e-waste.37 This is enough to fill 1.55 million 40-tonne trucks, which, if lined up bumper-to-bumper, would be enough to encircle the equator.39
The “recycling” myth is perhaps the most painful part of our “innocence.” Of those 62 million tonnes, less than one-quarter (22.3%) was documented as being properly collected and recycled.37
So, where does the other 77% go?
Much of it is shipped—often through uncontrolled and illegal movements—from high-income countries to low- and middle-income countries that have no infrastructure to manage it.40 This e-waste is laden with toxic chemicals like lead and mercury.41
There, it is processed in the “informal sector”.40 This is a euphemism for the world’s poorest people, including millions of women and children, breaking down our discarded electronics by hand or in open-air fires to recover tiny bits of valuable materials.37 This process can release up to 1,000 different chemical substances into the environment, including known neurotoxicants like lead.37
This is the direct, human cost. The World Health Organization (WHO) has linked this informal e-waste recycling to devastating health effects, from “developmental delays to stillbirths”.37 The “clean,” high-tech, advanced world of the Global North is built on a linear system that requires the toxic dumping of its waste onto the most vulnerable people in the Global South.
IV. The Atmosphere Strikes Back: A Planet’s Fever and Chills
The activities detailed in the previous sections—powering data centers with fossil fuels 17, running carbon-intensive manufacturing “fabs” 25, and fueling global logistics networks 34—all release massive amounts of greenhouse gases. The science is unequivocal: this human activity is the principal cause of the climate change we are now witnessing.42
This section will now connect those emissions directly to the “fever and chills” you first observed.
The Science of “The Oven”: Why Summers Are Hotter
This is the most direct connection. The greenhouse gases released by our technological-industrial economy trap more of the sun’s heat in the atmosphere.42 This doesn’t just raise the average temperature; it “loads the dice” for extreme events.1
As established in Section I, this warming leads to the formation of “heat domes”.6 NOAA’s analogy is the simplest: high pressure aloft acts as a “dome” or “cap”.5 Sinking air traps the heat at the surface, where it builds and builds, “like a lid on a pot”.6
Human-caused climate change is making these heat domes, and the resulting heat waves, more frequent, more intense, and longer-lasting.2 An event like the 2003 European heatwave, which killed 70,000 people, is now at least twice as likely to occur because of the emissions we have pumped into the atmosphere.1 The “hotter and hotter” summers are the planet’s fever, a direct response to the carbon blanket we have woven from our industrial and digital activities.
The Science of “The Freezer”: The Polar Vortex Paradox
This is the direct answer to the paradox that confuses so many. The extreme winter cold snaps are not a refutation of global warming; they are one of its most dangerous and counter-intuitive consequences.
As explained in Section I, the Arctic is warming much faster than the rest of the globe.7 This “Arctic Amplification” is weakening the temperature gradient between the pole and the mid-latitudes, which in turn destabilizes the polar jet stream and the stratospheric polar vortex.8
When the vortex is strong and stable, it acts like a spinning top, keeping the frigid air “penned in” over the Arctic. But a warming Arctic is like a force that slows that top down, causing it to wobble. This “wobble” manifests as a “stretched” 9 or “disrupted” 8 vortex.
These “stretching” patterns are the key. They allow lobes of frigid polar air to escape and plunge deep into the mid-latitudes, bringing Arctic weather to regions that are not prepared for it.9 This is precisely what happened during the 2024 Arctic blast that broke records from Montana to Texas 8, and what caused the record-breaking consecutive-day freeze in Texas in 2021.10
Your observation is therefore one of the most astute. You are not observing “global warming.” You are observing the destabilization of the entire Northern Hemisphere’s climate system. We have “unlocked” the freezer door at the top of the world, and now we are vulnerable to both record-breaking “oven” events and record-breaking “freezer” events. This is a far more dangerous and chaotic reality than a simple, steady warming.
V. The Prediction: What Happens After These Decades
You asked for a clear prediction of “what will happen after some decades”. This is not a matter of speculation. The world’s leading scientific and financial institutions—the Intergovernmental Panel on Climate Change (IPCC), the World Bank, the World Health Organization (WHO), and the World Economic Forum (WEF)—have run the projections.
What they describe is not a single, distant event. It is a “polycrisis”—a cascade of interlocking system failures, where each crisis amplifies the next. The future, if we continue on our current high-emissions path, is one of systemic collapse.
A World in Crisis: The Human Toll by 2050
Based on reports from the WEF and WHO, the human toll of climate change by 2050 is projected to be staggering:
- Health: The climate crisis could result in an additional 14.5 million deaths by 2050.43 This will not be from a single cause, but from the polycrisis: heat-related illnesses 2; malnutrition from crop failure 43; and the spread of infectious diseases as vectors like mosquitoes move into new, warmer regions.44 Climate change degrades the fundamental determinants of health: “clean air, water and soil”.45
- Economics: The global economy faces $12.5 trillion in economic losses by 2050.43 This will come from lost worker productivity during extreme heat, $1.1 trillion in extra healthcare costs 43, and the destruction of critical infrastructure from floods, wildfires, and storms.46
- Security: These stresses—food and water insecurity 44, economic collapse—will escalate tensions and increase the risk of new conflicts over scarce resources like water and arable land.47
A World on the Move: The Great Climate Migration
This is one of the most tangible and devastating predictions. As regions of the world become unlivable due to heat, drought, and sea-level rise, people will be forced to move.
- The World Bank’s “Groundswell” report projects that climate change could force 216 million people across six world regions to move within their own countries by 2050.48
- Other estimates are even higher. The Institute for Economics & Peace (IEP), an international thinktank, predicts that 1.2 billion people could be displaced globally by 2050 due to the rise in extreme weather and natural disasters.49
This is the great “injustice amplifier” of climate change. These displaced people are overwhelmingly the world’s poorest, “those who are contributing the least to its causes”.48 They are the people living in developing nations who are poisoned by our e-waste 41, and they will be the first to be displaced by our emissions.
A World Transformed: The Physical Toll by 2100
The physical changes to the planet will be non-negotiable. The most stark is sea-level rise, driven by melting ice sheets and the thermal expansion of a warmer ocean.50
- Global average sea level has already risen 8-9 inches (21-24 centimeters) since 1880.
- The rate of this rise has more than doubled from 0.06 inches (1.4 mm) per year in the 20th century to 0.14 inches (3.6 mm) per year from 2006–2015.50
The projections for the future depend entirely on the path we choose:
- Low-Emissions Path: If we are able to significantly reduce greenhouse gas emissions, U.S. sea level in 2100 is projected to be around 0.6 meters (2 feet) higher than it was in 2000.50
- High-Emissions Path (Current Path): If we continue on our current path with high emissions and rapid ice sheet collapse, models project that average sea level rise for the contiguous U.S. could be 2.2 meters (7.2 feet) by 2100.50
A 7.2-foot sea-level rise would be an extinction-level event for coastal cities around the world, from Miami to Mumbai, leading to the permanent displacement of hundreds of millions more people.
The following table summarizes the data-driven “prediction” you requested.
Table 2: The 2050 Warning: A Data-Driven Forecast
| Impact Metric | 2050 Projection | 2100 Projection (High-Emissions Path) | Data Source(s) |
| Human Displacement (Climate Migrants) | 216 million (Internal) – 1.2 billion (Global) | Not specified (Implied catastrophic) | 48 |
| Global Economic Loss (Climate-Related) | $12.5 trillion (by 2050) | Not specified (Implied catastrophic) | 43 |
| Excess Mortality (Climate-Related) | 14.5 million additional deaths (by 2050) | Global surface temp. rise: 1.5°C to 5.5°C | 43 |
| Global Sea Level Rise (vs. 2000 levels) | Hotspots emerge as early as 2030 48 | ~2.2 meters (7.2 feet) | 50 |
VI. Conclusion: From “Innocent People” to “Aware Public”
The user query for this report was a request for an “awareness blog post” for the “innocent people”. The findings of this report—from the staggering energy use of AI to the 1.2 billion people at risk of displacement—should make one thing clear: “innocence” is no longer an option.
“Innocence” in this context is a state of vulnerability. It is the “innocent” public that will suffer the consequences of a destabilized climate. It is the “innocent” children in the Global South who are poisoned by the toxic fallout of our “advanced” devices.37 It is the “innocent” coastal populations who will be forced to flee their homes.48
The projections for 2050 and 2100 are a warning, not a prophecy. The scientific evidence is clear that the severity of future effects depends on the “total amount of carbon dioxide we emit”.46 If we can reduce emissions, we “may avoid some of the worst effects”.46
The solution is not to abandon technology. The solution is to shed our innocence and demand accountability.
- Accountability for Energy: We must demand that the new, explosive energy demand from AI and data centers is met with new renewable energy sources, not by slowing the retirement of coal.17
- Accountability for Design: We must demand an end to the “take-make-dispose” model and the “business practice” of planned obsolescence.31 This means passing “Right to Repair” legislation and incentivizing durable, modular, and repairable products.
- Accountability for Waste: We must aggressively fund and deploy technologies to create a true circular economy, developing efficient techniques to recycle e-waste and recover the rare earth minerals already in circulation.52
The goal of this report was to provide the “awareness” you sought. Awareness is not a burden; it is a state of power. It replaces the vulnerability of “innocence” with the agency of knowledge. The work is not to mourn this loss of innocence, but to use that “awareness” to transform ourselves from an “innocent” public into an aware and demanding one. The future of a livable planet depends on it.
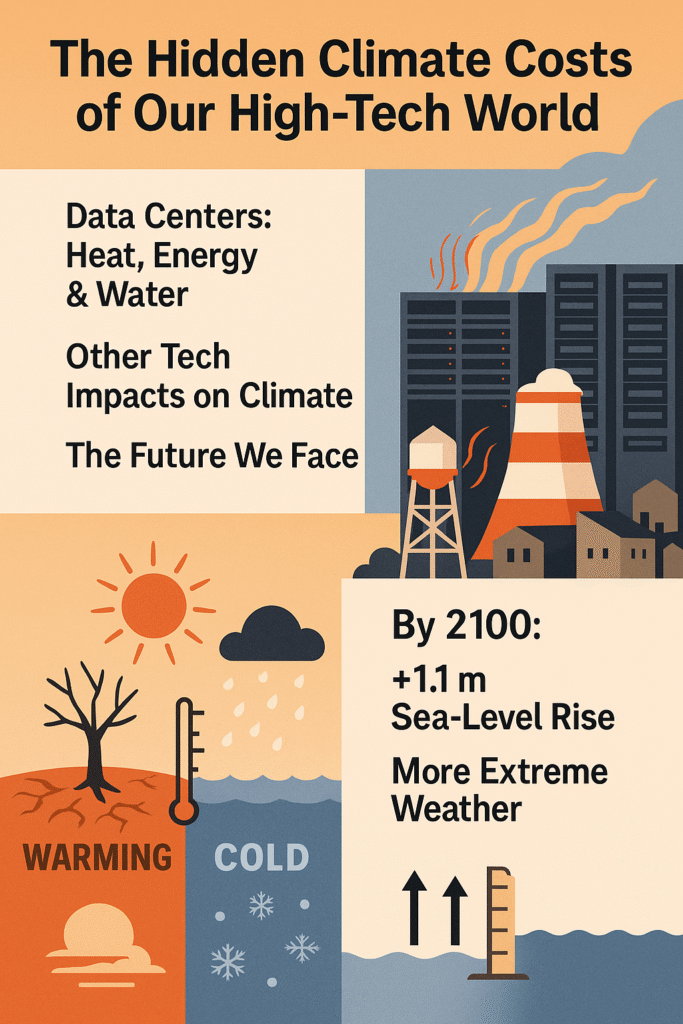
The Hidden Climate Costs of Our High-Tech World
Every new gadget and online service comes with a hidden climate cost. While tech promises convenience, the electricity and resources it consumes pump extra greenhouse gases into our atmosphere. Scientists note the world has already warmed about 1.1 °C since 1900 – an unprecedented rise in millennia, driven by our burning of fossil fuelsscied.ucar.edu. Now studies warn the digital boom will only increase that warming. For example, MIT researchers report global data center electricity needs (especially for AI and cloud services) could double by 2030 – reaching ~945 terawatt-hours per year, comparable to Japan’s total power usenews.mit.edu. Since much of this comes from coal and gas plants, it could add roughly 220 million tons of CO₂ annually (the same as thousands of car-years) by 2030news.mit.edu. In short, our tech-driven energy hunger is adding more heat-trapping gases to the planet every day.
Data Centers: Heat, Energy & Water
Modern data centers – those vast halls of blinking servers behind cloud computing and social media – act like giant furnaces. They run nonstop, generating enormous waste heat. To prevent overheating, operators pump chilled water through the servers, then dump the hot water or exhaust into the environment. The scale is hard to grasp: large data centers can use millions of gallons of water per day – roughly what a town of 10,000–50,000 people useseesi.org. Some hyperscale centers in dry regions (for example, in Arizona’s new AI hub) even tap local rivers or underground aquifers to stay cooleesi.orgparkplacetechnologies.com, intensifying drought risk. Meanwhile their cooling towers and fans vent constant warm air outside. Researchers warn this has already created noticeable “micro-climates” around some facilitiesparkplacetechnologies.com. In other words, each data center adds extra heat to its neighborhood and strains local water supplies – an impact most users never see.
Other Tech Impacts on Climate
Modern technology burdens the environment in many ways:
- Skyrocketing energy use: Data centers and networks run 24/7. One analysis predicts by 2030 our hyperscale tech infrastructure could emit as much CO₂ as 40% of today’s US emissionsparkplacetechnologies.com. Another report estimates up to 2.5 billion metric tons of CO₂ from data-center growth by 2030parkplacetechnologies.com.
- Huge heat output: High-performance chips produce intense heat. Cooling them takes even more electricity. Experts note the expelled warm air from cooling systems can raise local temperatures, altering weather around data farmsparkplacetechnologies.com.
- Water overuse: As above, cooling thirsty servers drains water. Using millions of gallons daily can stress wells and riverseesi.orgparkplacetechnologies.com. Some plants consume up to 5 million gallons each day – enough for a small cityeesi.org.
- Electronic waste: We replace gadgets quickly, and old devices become e-waste. Discarded electronics carry a large carbon footprint. A UC-Irvine study found GHG emissions from e-waste jumped 53% between 2014–2020 and could reach 852 million metric tons of CO₂ per year by 2030news.uci.edu. Improper e-waste disposal also releases toxic metals (lead, mercury, cadmium, etc.) into the soil and airparkplacetechnologies.com.
These factors show that our digital lifestyle – from streaming videos to running AI – contributes substantially to climate change, even if that’s invisible in our daily lives.
The Future We Face
If nothing changes, the warming will only get worse. Climate scientists warn that continued fossil-fuel emissions could push global temperatures several degrees higher by 2100scied.ucar.edu. Models show this would bring more intense heatwaves, droughts, heavy storms and wildfires. Melting ice caps would drive ~1.1 m of sea-level rise by 2100scied.ucar.edu, threatening coastal cities worldwide. Paradoxically, the record Arctic heat can also trigger harsh cold snaps in some winter regions – one study finds that despite the overall warming, severe cold-air outbreaks may become more frequent across the Northern Hemispherewoodwellclimate.org. In other words, a high-tech, high-emissions future means far more extremes: blistering summers and unexpected deep freezes, floods and famines.
In the next few decades, the effects could reach catastrophe for innocent people around the world. Crops will suffer, water will run short, diseases may spread, and extreme weather disasters could grow common. These outcomes are not wild guessing but clear warnings from scientistsscied.ucar.eduwoodwellclimate.org. If we keep building our digital world without reining in emissions and waste, the planet will pay the price – and so will we.
The world is experiencing unprecedented technological advancement, but few realize the devastating environmental price we are paying. While we celebrate faster internet speeds, smarter devices, and artificial intelligence breakthroughs, our planet is sending distress signals that demand urgent attention. The extreme winters are getting colder, summers are becoming unbearably hotter, and our addiction to technology is fueling this climate catastrophe far more than most people understand.
The Hidden Carbon Footprint of Our Digital Lives
Every email sent, video streamed, and social media post shared contributes to global carbon emissions in ways most people never imagine. The digital technology sector currently generates between 3.4% to 4% of global greenhouse gas emissions, matching the environmental impact of the entire aviation industry. This figure is not static—it increases by 5 to 7% annually and could double to 8% by 2025.
The infrastructure powering our digital world operates invisibly but consumes massive amounts of energy around the clock. Data centers, which store and process our online information, accounted for approximately 1% to 2% of global energy-related greenhouse gas emissions in 2023. In the United States alone, data centers consumed over 4% of total electricity in 2023-2024, contributing to more than 105 million tons of carbon dioxide equivalent emissions.
Data Centers: The Energy-Hungry Giants
Data centers require constant operation to keep servers running and cooling systems functioning at optimal temperatures around 20°C. This 24/7 power consumption, combined with the sector’s extraordinary growth, has led to alarming projections. By 2028, data centers may command 12% of all electricity demand nationwide in the United States. In Virginia alone, 25% of electricity generated already goes to data centers.
The environmental impact extends beyond electricity consumption. Data centers consume vast amounts of water for cooling purposes, creating imbalances that strain local water resources. In water-scarce regions like Mesa, Arizona, where an AI data center belt has emerged, this water consumption has prompted vigorous debates about resource allocation.
The Artificial Intelligence Energy Crisis
The rise of artificial intelligence has dramatically intensified the energy demands of digital technology. Training a single AI model can require computational power equivalent to the carbon emissions of five cars over their entire lifetime. A simple ChatGPT request uses 10 times as much electricity as a Google search.
Projections from the Lawrence Berkeley National Laboratory suggest that by 2028, over half of the electricity allocated to data centers will be utilized for AI, potentially consuming as much energy annually as 22% of all U.S. households. In 2023, data centers consumed 4.4% of U.S. electricity—a number that could triple by 2028. The carbon intensity of electricity used by AI facilities is 48% higher than the national average.
Streaming and Social Media: Small Actions, Massive Impact
Video streaming alone accounts for nearly 1% of global carbon dioxide emissions, with streaming responsible for 60% of all data flows on the internet. While one hour of Netflix streaming generates approximately 55 grams of carbon dioxide equivalent, the cumulative impact is staggering when multiplied by billions of users worldwide.
Social media platforms contribute significantly to digital emissions. TikTok generates the highest emissions per minute at 2.63 grams of carbon dioxide, followed by Reddit at 2.45 grams and Pinterest at 1.3 grams. The average person generates approximately 353,466 grams of carbon dioxide annually from social media use alone—equivalent to more than a return flight from Los Angeles to San Francisco.
Average internet users spend 40% of their waking hours online, and their digital consumption results in the emission of 229 kilograms of carbon dioxide per year. This represents 41% of the individual carbon budget necessary to limit global warming to 1.5°C according to the Intergovernmental Panel on Climate Change.
The Manufacturing Menace: Smartphones and Electronic Devices
The production phase of electronic devices creates the most significant environmental damage. Manufacturing a single smartphone generates between 60 to 85 kilograms of carbon dioxide emissions, with 80% to 95% of the device’s total lifetime carbon footprint occurring during production. This includes metal extraction, assembly, and transportation processes that deplete natural resources and destroy habitats.
Global smartphone production’s annual carbon footprint equals at least the emissions of a small country. The extraction of rare earth minerals like lithium, cobalt, and copper requires extensive and harmful mining techniques that produce significant carbon emissions and damage the Earth’s atmosphere.
Electronic Waste: A Growing Toxic Threat
The world generated 62 million tonnes of electronic waste in 2022, with only 22.3% properly collected and recycled. E-waste is growing five times faster than documented recycling efforts, and projections indicate this will reach 82 million tonnes by 2030—a 33% increase from 2022 figures.
E-waste contains toxic substances including lead, mercury, and cadmium that can seep into soil and contaminate water supplies when improperly disposed. When e-waste is recycled using unsound practices, it can release up to 1,000 different chemical substances into the environment, including known neurotoxicants. Smartphones alone contribute approximately 10% of global e-waste, with potential raw material value of $57 million wasted in 2019 due to poor recycling rates of only 17%.
Cryptocurrency: The Environmental Disaster
Bitcoin mining alone is responsible for approximately 0.6% of global electricity consumption. During 2020-2021, Bitcoin mining emitted over 85.89 million tonnes of carbon dioxide, with coal accounting for 45% of Bitcoin’s energy supply mix. Cryptocurrency mining contributes nearly 139 million tonnes of carbon dioxide equivalent in global greenhouse gas emissions annually.
The energy required for Bitcoin mining has increased exponentially. In January 2016, mining one Bitcoin required 1,005 kilowatt hours of energy; by June 2018, this surged to 60,461 kilowatt hours. The intensive electricity consumption from cryptocurrency mining directly contributes to higher carbon dioxide emissions that exacerbate climate change consequences.
5G Networks: Efficiency Gains Negated by Scale
While 5G networks are 90% more energy efficient per data bit compared to 4G predecessors, massive increases in density and traffic are expected to negate these savings. The net 5G energy consumption is projected to be 4 to 5 times higher than 4G. According to the French High Council for Climate, 5G rollout will lead to an 18-44% increase in the digital sector’s carbon footprint by 2030.
The deployment of 5G requires a vast number of new base stations and antennas, leading to increased carbon emissions considerably higher than previous generations of mobile technology. Infrastructure development for 5G necessitates materials like steel, concrete, and electronic components, all with associated carbon footprints from extraction, manufacturing, and transportation.
The Climate Crisis Intensifies: What the Future Holds
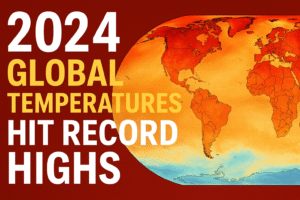
Global temperatures reached record levels in 2024, making it the warmest year on record at approximately 1.55°C above pre-industrial levels. The past ten years (2015-2024) represent the ten warmest years on record. Climate change added an average of 41 additional days of dangerous heat in 2024 globally.
Scientific projections paint an alarming picture of our future:
By 2030-2035: Global warming will likely reach the 1.5°C threshold under all emission scenarios. Climate change is expected to cause approximately 250,000 additional deaths per year from undernutrition, malaria, diarrhea, and heat stress.
By 2050: Even under low-emission scenarios, the planet is likely to warm by 2°C. Average maximum and minimum temperatures in regions like East Asia will rise by 1.4°C to 2.9°C. Without dramatic emissions reductions, global average temperatures could reach 2.5°C above pre-industrial levels. Urban land expansion of 78-171% will intensify urban heat islands, increasing extreme heat risks for half of the future urban population.
By 2100: Under intermediate emissions scenarios, global warming could reach 2.1-3.5°C, and under very high emissions scenarios, 3.3-5.7°C above pre-industrial levels. GDP may be hurt by between 2% to 10% relative to baseline scenarios, with potential damages of 12% when non-linearities are strong.
Extreme Weather: The New Normal
The frequency of extreme weather events has increased dramatically. Between March and May 2024, India endured heatwaves for 54 days. The number of disasters has increased by a factor of five over the past 50 years, driven by climate change and more extreme weather.
Climate projections show that the frequency of hot temperature extreme events will increase non-linearly with global warming, with larger percentage increases for rarer events. The frequency of heavy precipitation events will likely double and triple for 10-year and 50-year events respectively at 4°C of global warming. Concurrent heatwaves and droughts have become more frequent and will continue to increase with higher global warming.
Of 16 floods studied in recent research, 15 were driven by climate change-amplified rainfall. Fire weather conditions have become more probable in some regions and will become more frequent at higher levels of global warming. The probability of compound flooding from storm surge, extreme rainfall, and river flow will continue to increase due to sea level rise and increases in heavy precipitation.
A Dual-Edged Sword: Technology as Problem and Solution
While digital technology contributes significantly to climate change, it also offers potential solutions. Digital technologies could help reduce global carbon emissions by up to 15%—or one-third of the 50% reduction required by 2030—through solutions in energy, manufacturing, agriculture, buildings, transportation, and traffic management.
Digital technology can significantly reduce carbon emission intensity and improve carbon emission efficiency by promoting green technological innovation, reducing energy intensity, and optimizing industrial structures. However, these benefits will only materialize if we urgently prioritize sustainable practices and dramatically reduce the energy footprint of our technological infrastructure.
What We Must Do Now
The trajectory we are on leads to catastrophic consequences. Without immediate and aggressive action, we face a future where:
- Extreme weather events become routine occurrences
- Water resources become increasingly scarce due to both climate impacts and technology infrastructure demands
- Mass displacement occurs as regions become uninhabitable due to extreme heat
- Food systems collapse from disrupted agriculture and unpredictable weather patterns
- Economic damages escalate exponentially, potentially reducing global GDP by 10% or more by 2100
- Biodiversity loss accelerates as ecosystems fail to adapt to rapid temperature changes
Individual actions matter. Reduce streaming quality, limit social media usage, delete unnecessary emails and files, keep devices longer, choose refurbished electronics, enable power-saving modes, and reduce screen time.
However, the greatest responsibility lies with technology companies and governments. They must transition data centers to 100% renewable energy, implement aggressive energy efficiency standards, invest in carbon capture technologies, mandate longer product lifecycles and repairability, and establish comprehensive e-waste recycling infrastructure.
The Moment of Truth
We stand at a critical juncture in human history. The technology that promises to improve our lives is simultaneously destroying the planet that sustains us. Every degree of warming matters. Every fraction of a degree increases impacts on our lives, economies, and planet.
The blazing temperatures of 2024 require trail-blazing climate action in 2025. The time for incremental change has passed. We need radical transformation of how we produce, consume, and dispose of technology. The choice is ours: continue on this path toward environmental catastrophe, or make the difficult but necessary changes to ensure a livable planet for future generations.
The invisible carbon footprint of our digital lives is very real, and its consequences are already manifesting in the extreme weather patterns we experience today. The question is not whether we can afford to act—it is whether we can afford not ton afford not to.


1 comment